 Indonesian
  English
  简体中文
简体中文  繁體中文
繁體中文  Malayu
  ภาษาไทย
  Việt
Việt  العربية
  한국어
한국어  日本語
日本語  Español
  Français
  Português
  Deutsch
The story started when the TerraUSD collapse started on May 7, falling from $1 to $0.007 today. However, the big question is where cryptocurrencies are going?
To answer this vague question, it is necessary to read the crypto leader, the Bitcoin. Next are the major fundamental and technical reading with detailed readings and expectations.
The Review:
Bitcoin sank to the lowest in about 18 months after the freezing of withdrawals by the Celsius lending platform, adding to the concern that systemic risk in the crypto ecosystem will accelerate the digital-asset market meltdown.
The collapse of the Terra/Luna ecosystem last month, and lender Celsius pausing withdrawals Monday, have further wrinkled certainty in this space. However, traders expect Celsius to face additional risks if the broader market sell-off intensifies. Also, Binance, the largest crypto trading platform, temporarily suspended withdrawals of the Bitcoin network because of a transaction processing issue, but withdrawals were later resumed.
Additionally, the world’s largest digital token tumbled 17%, reaching $20,000 and recording its lowest price since December 2020. Meanwhile, other cryptocurrencies also declined as a broader sell-off continued. Moreover, the MVIS CryptoCompare Digital Assets 100 Index, which measures top 100 tokens, dropped as much as 17%. And the total market value, which topped $3 trillion in November, dropped below $1 trillion in New York early this week.
Technically: Daily Chart (Medium term)
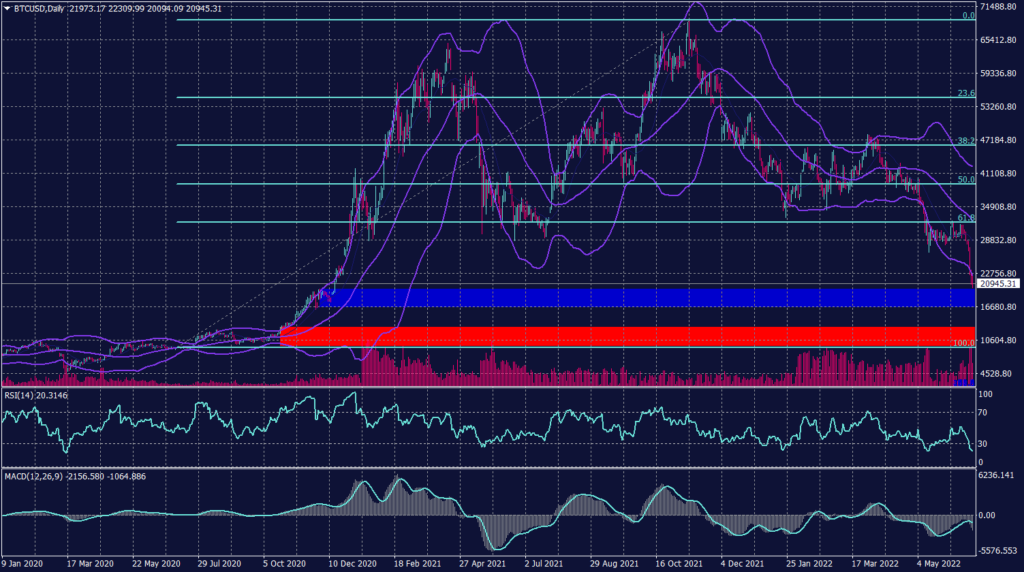
The leading cryptocurrency fell below its 18 months low, reaching a critical range between $20,000 and $16,000 (the blue range), which is supposed to absorb the momentum and slow down the fall. However, in the most probable scenario, the support range will not be enough to stop the fall, especially if the price falls below $18,400.
The volume of trading and sell-off is pressuring the Bitcoin towards the range between 12,500 and 10,000 (the red range). Furthermore, the 55 days moving average retains its negative signals and indicates resistance at $29,300. However, the Bollinger Bands signal a possibility of a corrective bounce from between $19,000 and $21,000. Meanwhile, RSI show overselling of BTCUSD and reads below 20 and BTCUSD below $20,000 while the MACD signals further decline and are heading towards $18,500 in the short term.
To conclude, the daily chart readings indicate a further decline, confirmed by most of the major technical indicators. Additionally, the trading volume and price action also pressure the prices below $18,500 in the short and medium terms.
Technically: Weekly Chart (Long term)
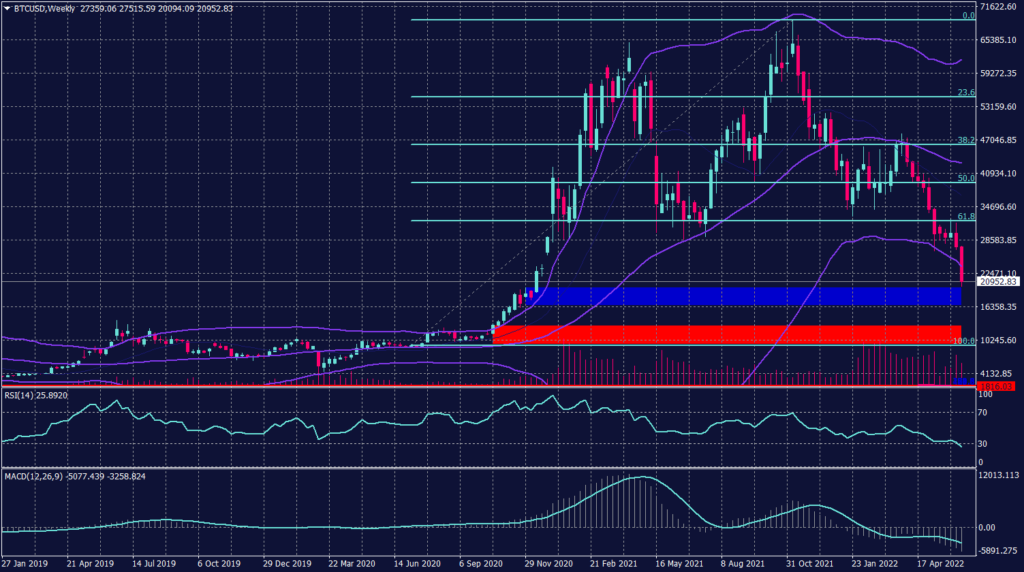
On the weekly chart, the Bitcoin chart does not show signs of recovery or correction. The weekly chat forming head and shoulders with a neck at $35,000, which was broken on May 8. Additionally, the long-term reading targets the bottom between $10,000 and $12,000 with a possible slowdown near $18,500 before the continuation.
Furthermore, Fibonacci retracement confirms the reading of the chart with the bottom below $10,000. On the other hand, technical indicators signal a continuation of the decline but no clear signal where the target is.